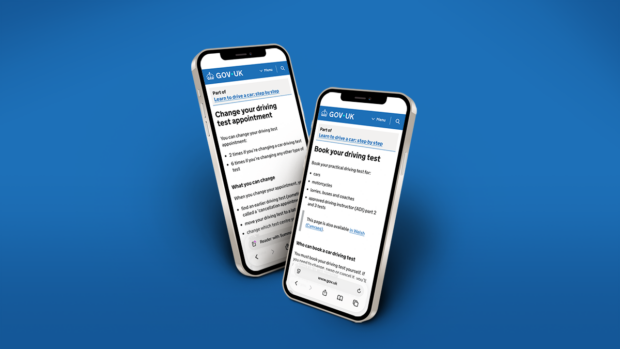
Learner drivers, driving instructors, driving schools and associations and the public deserve a clear and honest picture of how the driving test service is performing.
That's why today we're publishing new data on GOV.UK that gives a fuller view of waiting times than ever before - and we'll be updating it every month, broken down by each individual driving test centre.
Why we're giving you more data about waiting times and test availability
Many of you will be familiar with the waiting time figure we currently use. Although this is widely seen as the average time people wait for a test, it’s actually the number of weeks until at least 10% of weekly test appointments at a centre are still available to book. We call it the existing 10% availability measure and this blog post from John Selbey in October 2023 explains what the driving test waiting time actually means.
It's a useful indicator of availability at the point of booking, but a National Audit Office (NAO) investigation last year found it does not reflect how long learners actually wait between booking and taking their test. The NAO suggested that we should explore whether there is alternative data which more accurately reflects the actual experience of learners.
We've acted on that finding and your feedback, and from today, we’re starting to report some additional measures to help give you a clearer picture of driving test waiting times.
What the new data includes
The additional pieces of data we are now reporting are:
- the average waiting time between booking and taking a driving test (median)
- the number of tests provided in a month through driving examiner overtime
- the total number of appointments that we’ve made available over the next 24 weeks of the booking window (as measured at the end of the month)
- the total number of tests that have already been booked in that booking window
- the total number of tests that are still available to book in the booking window
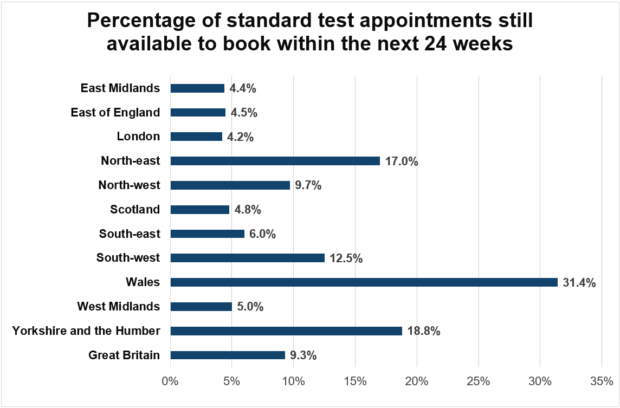
- the percentage of tests that are still available to book in the booking window
All of this is available at national, regional and driving test centre level. It will be updated on the second Wednesday of each month with the previous month’s data.
View the new data on driving test waiting times and availability.
Why the median waiting time is important
The median waiting time between booking and taking a test is an important addition.
Because it's based on every single completed test, it gives a much more honest picture of what learners are actually experiencing.
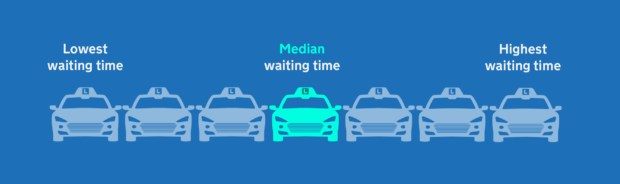
To work it out, we take every test completed in the month and line them all up in order, from the shortest wait to the longest. The median is simply the waiting time of the person in the middle of that line.
This means half of all learners waited less time than the median figure, and half waited longer.
What the data tells us - and why it matters for you
The new data helps explain something many of you will have noticed in practice: the headline availability figure does not always match what your pupils are actually experiencing.
In some centres, learners are getting tests significantly sooner than the existing 10% availability measure suggests.
At Darlington, for example, the existing measure stood at 13 weeks in May 2026 - but the median waiting time was just 6.7 weeks. This means half of all learners were taking their test in roughly half the time as the existing figure implied.
Similar gaps appear at test centres like St Helens (16.5 weeks vs 6.1 weeks median), Barrow in Furness (12 weeks vs 4.6 weeks median) and across several Yorkshire centres including Wakefield (15.8 weeks vs 5.7 weeks median) and Bradford Thornbury (15.5 weeks vs 4.9 weeks median).
For instructors in these areas, this is good news. It’s the kind of detail that can help you have better conversations with your pupils about when to expect their test.
However, the data also shows that in other parts of the country, waits remain genuinely long by both measures.
Pinner (10% measure: 24 weeks, median: 23 weeks), Birmingham Kingstanding (24 weeks vs 23 weeks median) and Sidcup (24 weeks vs 22 weeks median) are among them. Banbury had the highest median of any centre in England at 24.3 weeks.
How the median can be higher than 24 weeks
That last example raises an interesting question; how can the median waiting time be higher than 24 weeks?
This happens when a learner books near the end of the booking window and later postpones their test - by which point the new date falls beyond the original 24-week window. The median includes all completed tests, whether learners moved their appointment earlier or later.
We know these longer waiting times are frustrating for you and for your pupils, and it's exactly why we're publishing this level of detail - so that the experience of all learners is visible and we can be held to account for improving it.
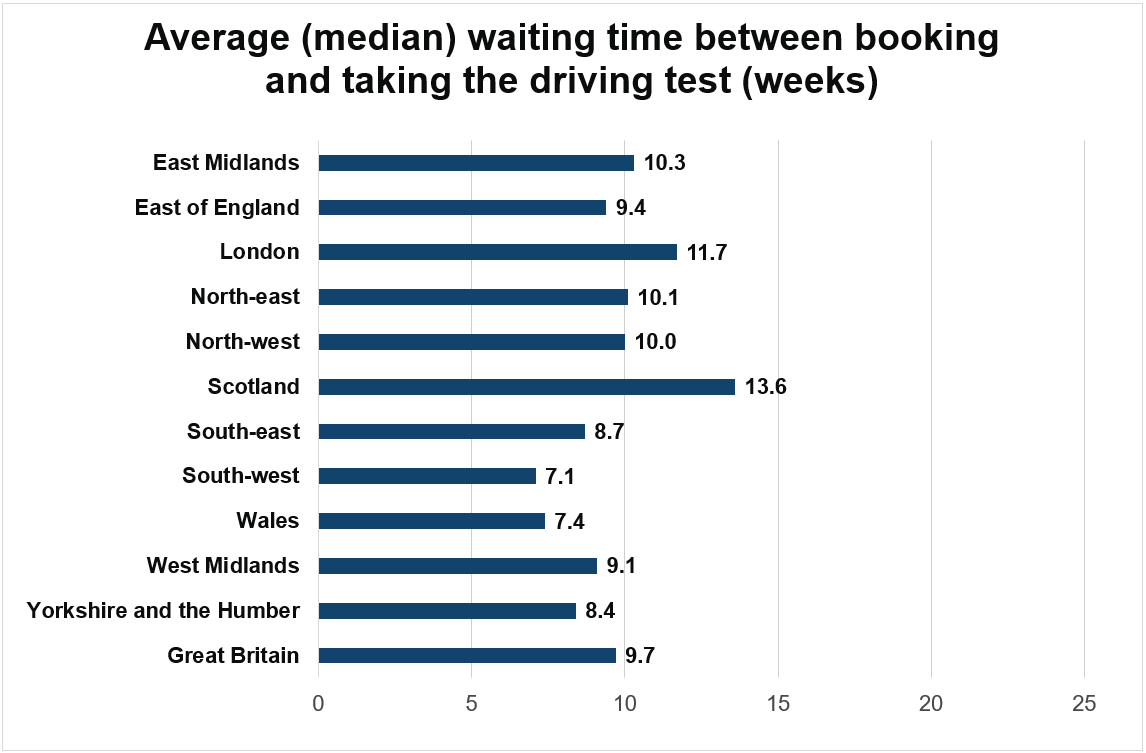
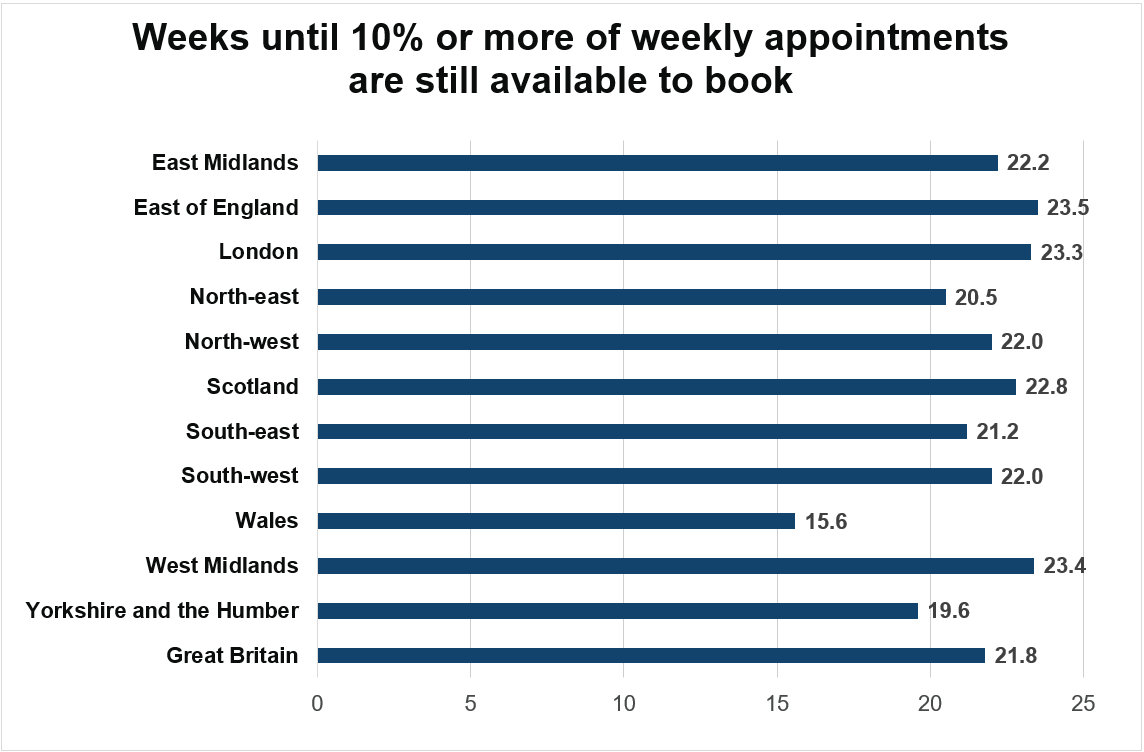
How each region performed in May 2026
The charts below summarises performance by region - you can find the full breakdown for each individual test centre in the data published on GOV.UK today.
Why the median waiting time looks shorter than the existing 10% availability figure
In many cases, the median waiting time is shorter – and in some cases significantly shorter - than the existing 10% availability figure. It reflects something important about how the two measures work. Understanding the difference will help you explain it to your pupils.
The existing 10% availability measure tells you how far into the future you need to look before an ample number of appointments are still available to book. A centre showing a figure of 22 weeks is because, in the weeks before that point, fewer than 10% of appointments are still available.
But "fewer than 10% available" does not mean zero. At a busy centre doing 200 tests a week, even 5% availability means 10 slots still open in that week. Across a region with dozens of centres, that can mean hundreds of bookable appointments every week before the 22-week point. Across the country as a whole, it could mean thousands.
So while the existing 10% availability measure might read as 22 weeks, learners who check regularly and pick up cancellations can often secure a test much sooner than that figure implies. And this is exactly what the new median data captures. It counts every test actually taken in the month and finds the middle value.
When the national median is 9.7 weeks against a 10% availability measure of 21.8 weeks, it tells us that half of all learners who took a test in May waited less than 9.7 weeks - even though the existing 10% availability figure suggests they faced a much longer wait.
This is also why the median is a better guide for the conversations you have with pupils. Rather than telling them to expect a 20-plus week wait, the data suggests that learners who check regularly for earlier slots are often taking their test within 10 weeks or less.
Encouraging your pupils to check availability regularly can make a real difference.
The action we're taking
This transparency commitment builds on the steps we’re already taking to improve waiting times.
Between June 2025 and May 2026, we did close to a quarter of a million extra car driving tests compared to the same time the previous year. Driving examiner numbers are at their highest level since 2019.
We’ve changed the booking rules to protect your pupils from exploitation by unofficial services and resellers. We've stopped it being possible to hoard tests at a test centre with no intention of taking tests there, only to move them elsewhere in the country.
We recognise that many learners are still experiencing extended waits, and we're not complacent about that. Our goal remains to reduce waiting times across Great Britain. Publishing this richer data openly and regularly means you - and your pupils - can track our progress honestly, centre by centre.

16 comments
Comment by Bert posted on
The article, whilst well-intentioned, is just yet again more "cherry picking". If I was the CEO of NAO I'd be suing DVSA for continually mis representing our findings, even though those findings were not actually free from political pressures!
You want to fix the problem using the current available resources? Simple it's summer 2026 Daylight from 05:30 - 21:15 7 days a week!! So why are tests not going out in every single test centre on a Sunday? Why is the last test 14:50 apart from 'overtime test' which again is back by 16:10 absolutely farcical.
Comment by Lucy posted on
We want to be clear that the data shared reflects the current position as consistently as possible, rather than selecting favourable measures. We are also expanding what we publish so that the picture is more complete and transparent. We will continue to publish the existing waiting time figure (the number of weeks until at least 10% of weekly test appointments at a centre are still available to book) alongside the new data.
On test availability, we are already delivering significant additional testing capacity, including evening and weekend sessions through overtime. Decisions on extending this further need to balance examiner availability, safety and sustainability alongside demand. We continue to review how capacity is deployed across the week, including weekends, as part of our wider effort to reduce waiting times.
Comment by Robin Lamport posted on
In effect your statistics mean absolutely nothing. The national median simply looks like massaging the figures with no real influence to your charts. It's a smoke screen and you continue to miss inform the driving industry. I'm still in a negative frame mind because of how you have taken so long to do anything about it. I hope in the future you have a system to take over should a disaster arises. Planning is paramount.
Comment by Lucy posted on
The data we’ve published is designed to give a clearer and more consistent view of waiting times across the country, alongside additional metrics that show demand and availability more openly. We will continue to publish the existing waiting time figure (the number of weeks until at least 10% of weekly test appointments at a centre are still available to book) alongside the new data. As well as this, we are taking sustained action to increase capacity (through recruitment, training and additional test delivery) and to improve how the booking system operates. We agree that long term resilience and planning are critical and those are central to the changes now being implemented. We recognise that trust has been affected by the length of time it has taken to address waiting times and we are working to be more transparent about the position now.
Comment by David posted on
The fact that you have now removed the ability for ADI's to even VIEW test availability, makes it extremely difficult to have a conversation with a pupil about when to book a test and what availability there might be at their local driving test centre.
Comment by Lucy posted on
The booking service changes were introduced to reduce misuse of the system and ensure that access to test availability is fair for all learners. We recognise this has made it harder for ADIs to advise pupils based on real time availability and we understand the impact that has. We are continuing to look at how we can support ADIs to have informed conversations with pupils - for example, through clearer published data and guidance - while still maintaining the integrity and fairness of the booking system.
Comment by Mr Andrew J Hebditch posted on
Surely the median waiting time is pointless as a large proportion of those that moved their tests did so with the benefit of apps like TESTI. The fact that the DVSA have almost seen it as their mission to make it harder for pupils to find and change their tests means that that median figure is likely to go up.
Comment by Lucy posted on
We understand the concern about how behaviour in the system, particularly use of apps to find earlier tests, can affect what people experience day to day. However, our recent changes are focused on making the system fairer for all learners by reducing the advantage gained through third party automation and improving access to genuine availability. We expect this to provide a more transparent picture over time, even if it changes how some individuals experience the system in the short term. We are publishing the median waiting time in response to the National Audit Office (NAO) findings about our 10% availability measure. The median gives a consistent national measure over time. It is not intended to reflect every individual’s journey, particularly where people actively move their test. That’s why we are now publishing a broader set of data alongside it, so people can see a fuller picture of availability and demand.
Comment by SUSAN THORNTON posted on
Instead of producing your endless stats of which the actual pass rate for driving test has barely fluctuated for 30 odd years, actully DO SOMETHING , .
Comment by Lucy posted on
We recognise the strength of feeling on this and we agree that reducing waiting times is what matters most to learners and instructors.
The data we publish is there to be transparent about the scale of the challenge and how it is changing over time - but it is only one part of the work. Alongside this, we are increasing testing capacity through recruitment and training of new examiners, delivering additional tests through overtime and making changes to the booking system to reduce misuse and improve fairness.
We know there is more to do and our focus remains on sustained actions that will bring waiting times down over time.
Comment by robert taylor posted on
There is not enough being done my main test centers i use are Hornchurch and goodmayes people are still using software to access the tests before any students can get them . I’ve been offered tests for sale what is totally illegal!! Plus i spoke to an examiner 2wks ago they told me one driving school with just two cars done 12 !!! Test in one day there is no way that is a coincidence
Comment by Lucy posted on
We are aware of continued concerns around the use of automated tools and the resale of test appointments and we take this very seriously.
We have already introduced changes to reduce automated access to the booking system and to limit bulk booking behaviour. These changes are designed to ensure tests are accessed more fairly by individual learners.
We are also continuing to investigate reports of misuse and apply enforcement action where appropriate. If you have specific evidence of tests being sold, we would encourage you to report this so it can be looked into.
We recognise there is more to do in this space and further improvements to the system are being developed.
Comment by Sualdam MacSamildanach posted on
You won't publish this, but I will say it anyway.
Any of my pupils booking right now in Nottingham, it's October at best. That's 19 weeks - double your 'median'.
You are obfuscating with statistics to try and make it sound better. Worse still, you are using metrics which there is no historical precedent for, so there is nothing to compare with. It just you telling us how great it is.
The bottom line is that it is still likely a 5 month wait for a test - but if you keep checking, the chances of finding a cancellation sooner are slightly better.
Comment by Lucy posted on
We understand that experiences at individual test centres can differ significantly and in some areas waiting times are still much higher than the national picture.
The national median is used as a consistent overall measure, but it is not intended to reflect every local experience. That’s why we are now publishing a broader set of data at national, regional and local level, alongside historical data back to 2019, so that differences between areas and trends over time are clearer and more transparent.
We are not suggesting the situation is where we want it to be. Waiting times remain too high in many locations, and our focus is on increasing capacity and improving how tests are allocated so that learners have a fairer and more consistent experience across the country.
We recognise that some learners are still waiting several months and reducing that remains the priority.
Comment by Sarah Wallace posted on
Using the median certainty does not reflect the experience of people and would seem to further increase peoples frustration.
So getting a test date only to fail and then to wait around 6 months for further test is where I’m at in my area. There must be better solutions to this than to make the statistics sound better.
Comment by Lucy posted on
We understand that experiences at individual test centres can differ significantly and in some areas waiting times are still much higher than the national picture.
The national median is used as a consistent overall measure, but it is not intended to reflect every local experience. That’s why we are now publishing a broader set of data at national, regional and local level, alongside historical data back to 2019, so that differences between areas and trends over time are clearer and more transparent.
We are not suggesting the situation is where we want it to be. Waiting times remain too high in many locations, and our focus is on increasing capacity and improving how tests are allocated so that learners have a fairer and more consistent experience across the country.